MosquitoDB
latest
1. Overview
2. Getting Started
3. Project Management
4. Forms Management
5. User Management
6. Data Visualization
6.1. Data Summary
6.2. Working with Charts
6.3. Datasets
6.4. Downloading Data
7. Settings
8. MosquitoDB App
9. Appendix
MosquitoDB
»
6.
Data Visualization
»
6.2.
Working with Charts
Edit on GitHub
6.2.
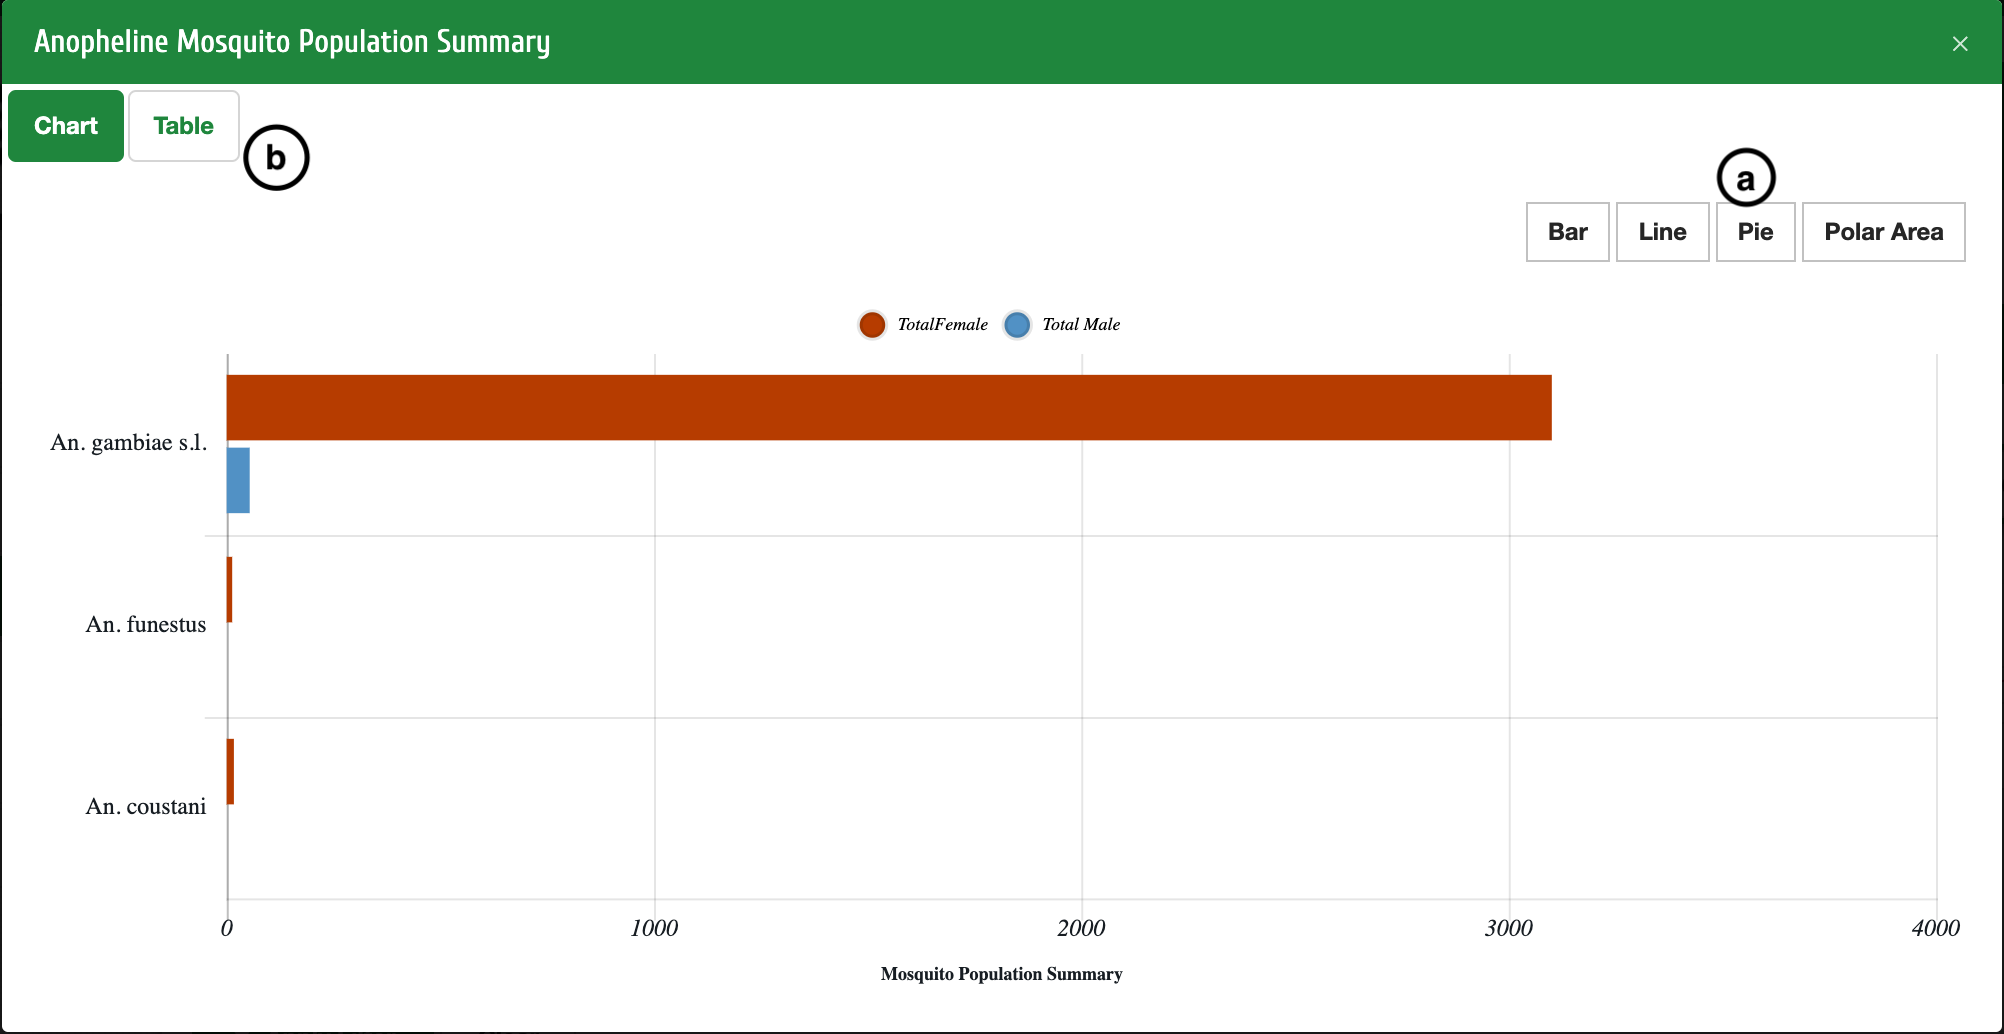
Working with Charts
You can view different charts by selecting either Bar, Line , Pie or Polar Area
b
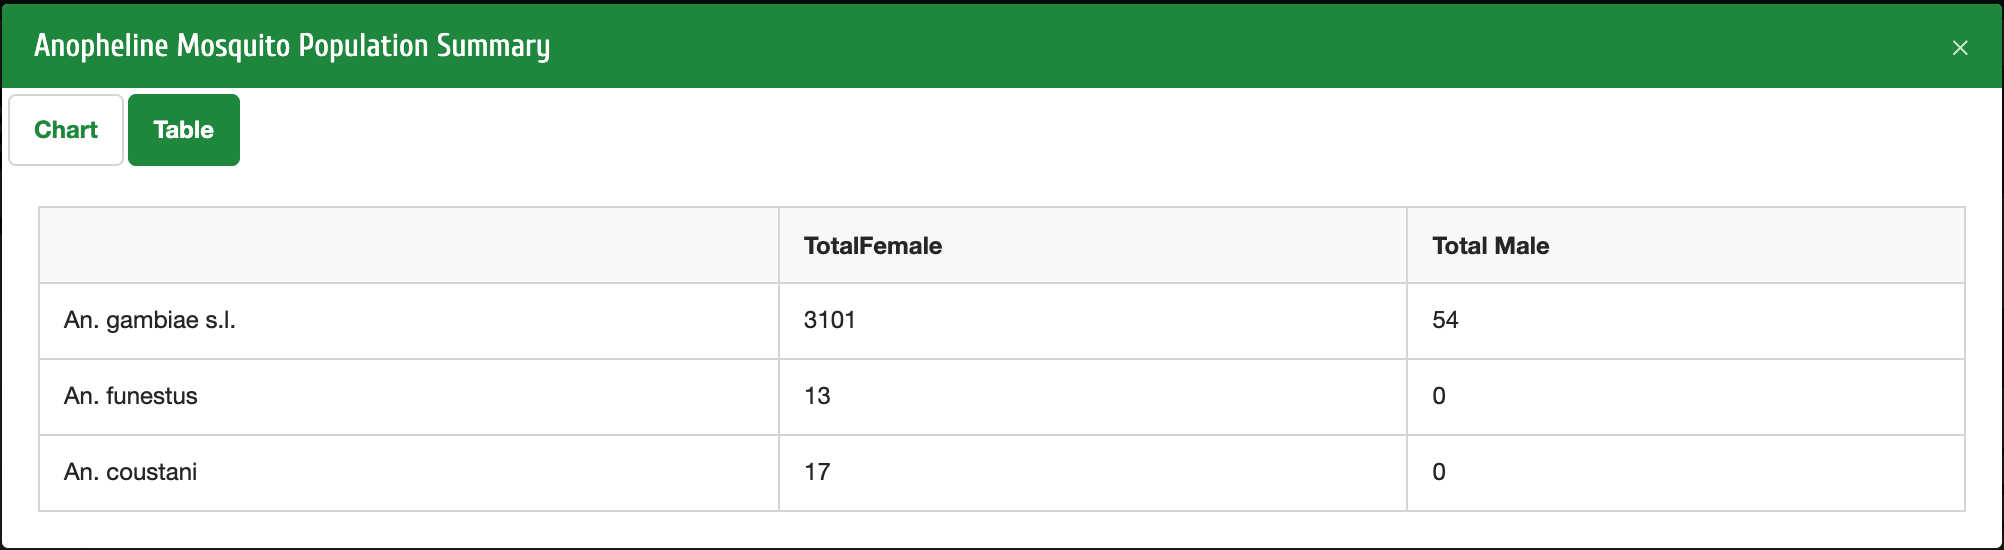
: You can select Table to view the data in tabular form